Observability
Watch what Lorenz is doing: which agents run, what they spend, why a candidate is blocked, and what each agent did on a given issue. For operators running the daemon who want a live picture without reading logs line by line.
Lorenz exposes one source of truth and three views over it. The source is the runtime's in-memory RuntimeSnapshot. The views are the Ink terminal dashboard (TUI), the web dashboard, and the lorenz runs command. A fourth view, Traceviz, replays the full per-issue event timeline.
The snapshot and its three views
The runtime holds a single immutable RuntimeSnapshot: running agents, the retry/backoff queue, dispatch blocks, run history, token usage totals, rate limits, and recent events. Every operator view reads from this one structure, so they never disagree about live state.
The path from runtime to screen is the same whichever view you open. The runtime projection module keeps the bounded recentEvents and runHistory slices and deep-clones snapshot fields so a consumer can never mutate runtime state. @lorenz/presenter converts the camelCase snapshot into the snake_case JSON the HTTP API and WebSocket serve. @lorenz/tui formats the same snapshot into the terminal dashboard.

A few facts hold across all three views:
recentEventsis capped at the last 20 entries, newest first.runHistoryis capped at the last 50 entries, newest first.- The presenter sets
cost.estimated_cost_usdtonulleverywhere. Cost is reported from token totals, not dollars. - The snapshot's
reservingfield (slots mid-acquire) is carried by runtime projection and surfaced only in the TUI (as thersvlane); the web dashboard andlorenz runsdo not show it.
The terminal dashboard (TUI)
The TUI is on by default. It renders only when process.stdout.isTTY is true. Pass --no-tui to disable it; without a TTY the runtime writes a JSON snapshot to stdout on every update instead.
It refreshes every 250ms. Throughput is a 5-second rolling window, recomputed at most once per wall-clock second.
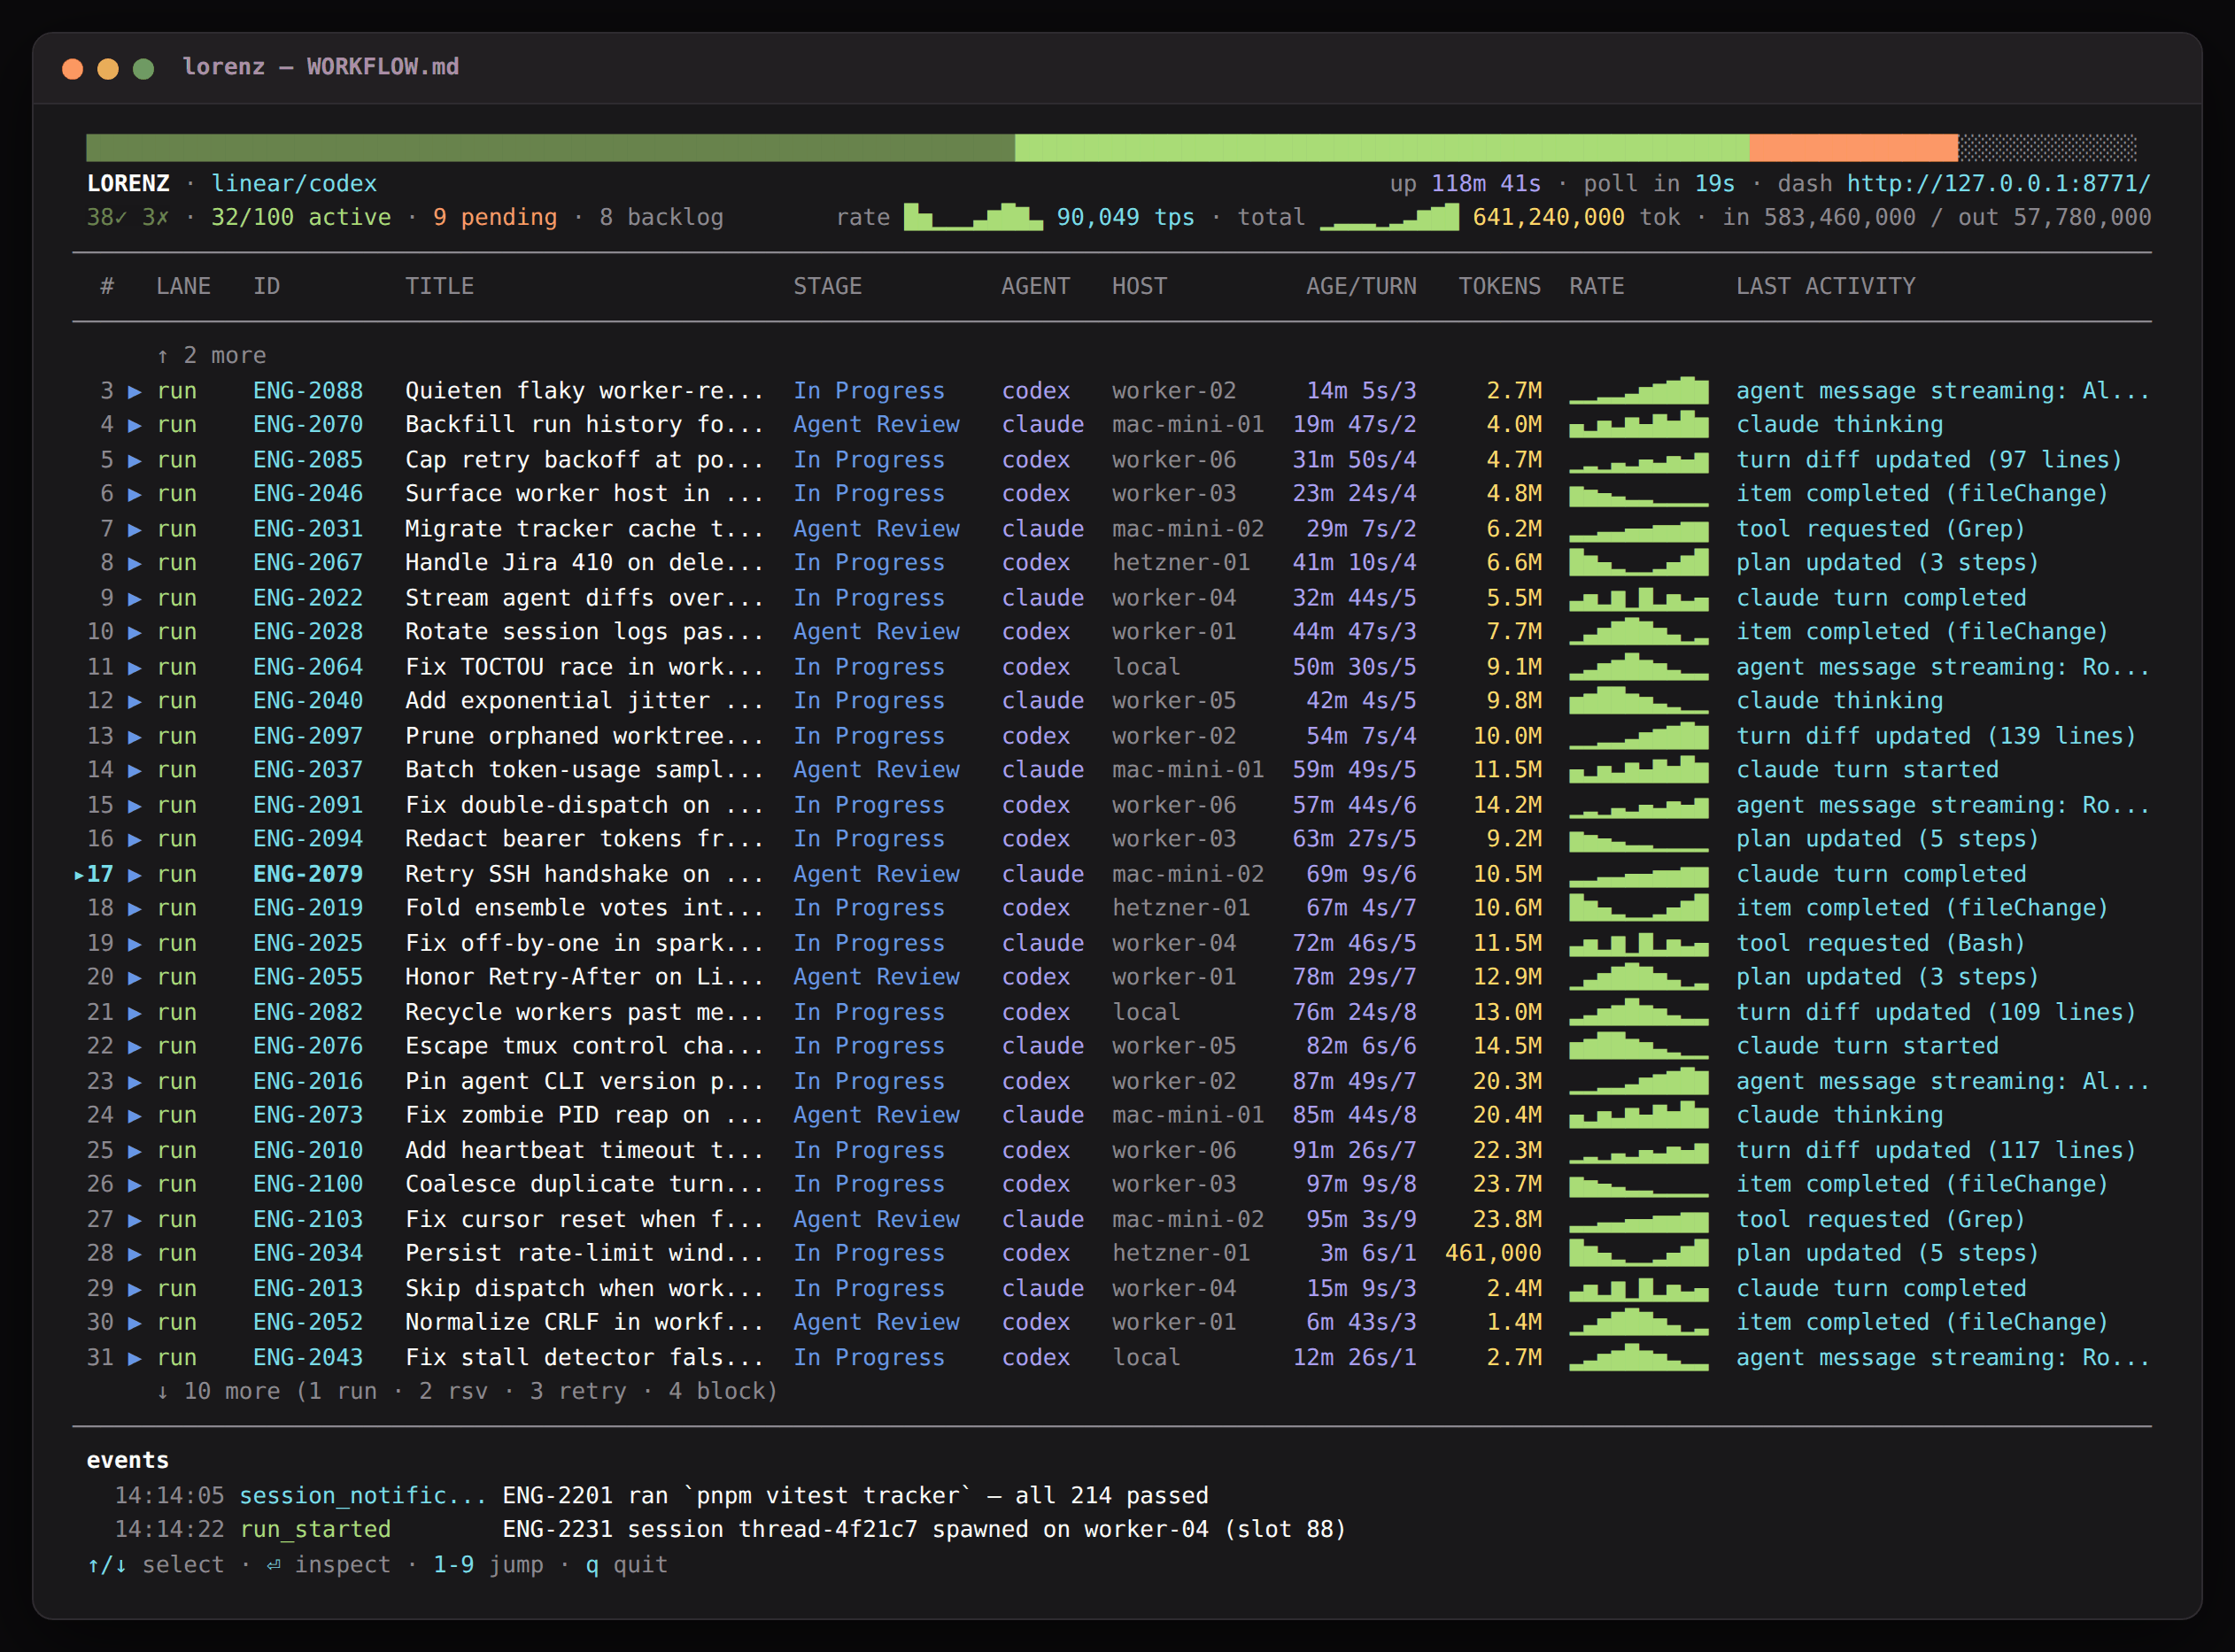
From top to bottom:
- Fleet status bar. One stacked pipeline bar spanning the full width: terminal states reached in this orchestrator instantiation (muted, with the ✓/✗ split in the legend), active runs, pending lanes (reserving, retrying, blocked), and the remaining dispatchable backlog (hollow).
- Identity and vitals.
LORENZplus the configured tracker and agent kinds on the left; uptime, poll countdown, and the dashboard address on the right. The legend line below carries the concurrency cap (N/max active) and the paired throughput charts: a moving 60-second token-rate histogram beside the tokens-per-second figure, and a cumulative-total histogram beside the running token total. - Flight board. One row per issue in the pipeline. Running, reserving, retrying, and blocked are lanes (
run/rsv/retry/block) in a single table with issue title, tracker stage, agent kind, worker host, age and turn count, token total, a live per-run rate histogram when width allows, and the humanized last activity. The layout is responsive: lower-priority columns drop as the terminal narrows (the lane marker and row color keep encoding the lane), and when the terminal height is known the table windows itself around the selection cursor (↑ N more/↓ N morewith lane counts), so a fleet of 100 agents fits any viewport. - Event tape. The most recent humanized runtime events, newest at the bottom.
In a TTY the board is interactive: ↑/↓ move the cursor and ⏎ (or digits 1-9) narrows into a detail card for one running agent — session, pid, workspace, issue URL, retry attempt, the run's token-rate and cumulative histograms, and the event tape filtered to that agent. ←/→ cycle between agents, esc returns to the board, and q quits.
The observability.* config keys (dashboard_enabled, refresh_ms, render_interval_ms) are parsed and defaulted (true, 1000, 16), but the TUI uses the hardcoded 250ms refresh and 5-second throughput window. refresh_ms and render_interval_ms are not consumed by the TUI.
The web dashboard
Lorenz serves a React single-page app and a JSON API from a Hono server (startObservabilityServer). The server is on by default; pass --no-dashboard to disable it.
The server binds server.host (default 127.0.0.1) and server.port (default 4040). Port 0 means an ephemeral port. After the bind, Lorenz rewrites server.port to the bound port and prints Observability API listening on <url> to stderr. The --port flag overrides server.port.
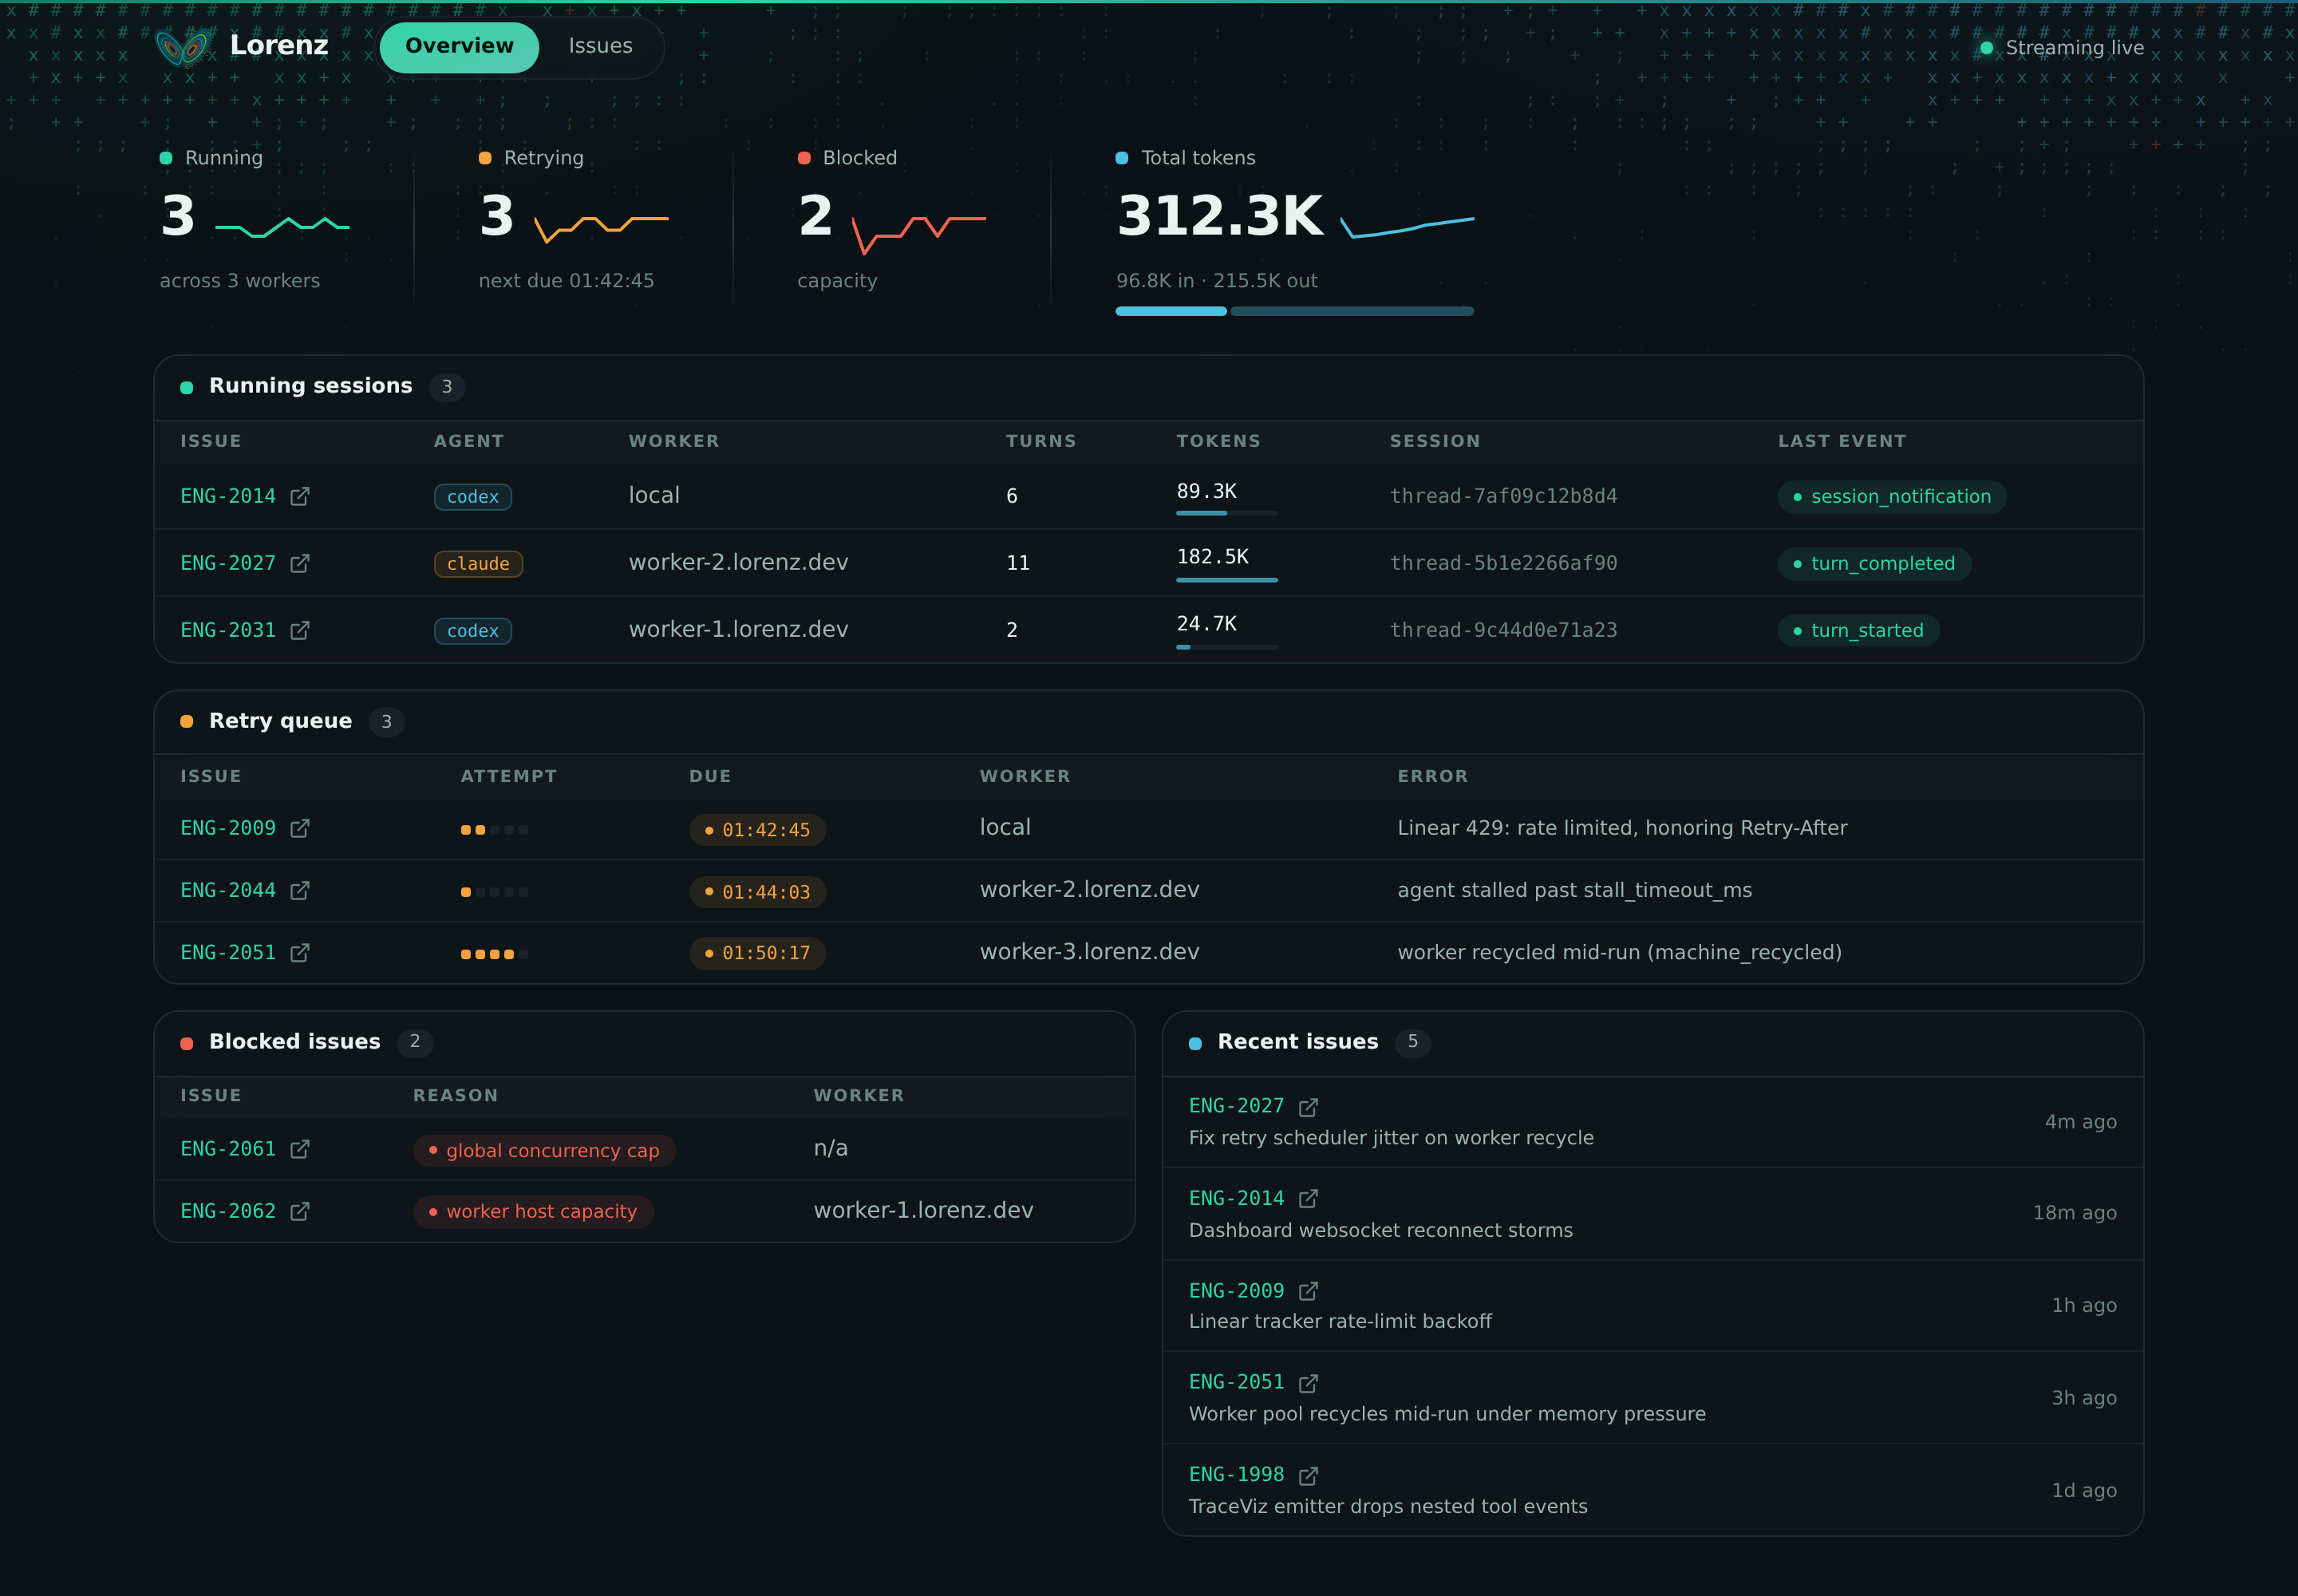
The Overview shows metric cards plus Running, Retry, and Blocked tables, seeded once over REST and kept live over the WebSocket. The dashboard uses a hash router: #/ is the Overview, #/trace/<issueId> is the trace viewer.
If the built SPA assets are missing, GET / returns 503 with {code: 'dashboard_not_built', message: 'Dashboard assets not found. Run: pnpm build'}. Build the dashboard first.
HTTP API and the WebSocket
The server mounts REST routes under /api/v1, a /ws WebSocket for live push, a /health check, and a /mcp endpoint. The state and run routes are registered before the catch-all GET /api/v1/:identifier so they are not shadowed.
| Route | Method | Purpose |
|---|---|---|
/api/v1/state |
GET | Current ops state payload |
/api/v1/runs |
GET | Run history; filters issue, failed, cost, retries, id, limit |
/api/v1/refresh |
POST | Queue a poll + reconcile with a control bearer token (202, operations: ['poll','reconcile']) |
/api/v1/daemon |
GET | Daemon owner, endpoint, heartbeat, and leadership status |
/api/v1/stop |
POST | Request daemon shutdown with a control bearer token |
/api/v1/:identifier |
GET | One issue's detail |
/api/v1/issues/recent |
GET | Recent issues (trace) |
/api/v1/issues/search |
GET | Issue search (trace) |
/api/v1/tickets |
GET | Known trace tickets |
/api/v1/tickets/:id/exists |
GET | Whether a trace ticket exists |
/api/v1/tickets/:id/events |
GET | A ticket's trace events |
/ws |
GET (upgrade) | Live ops_state + trace push |
/health |
GET | Health check |
/mcp |
POST | MCP endpoint |
The runs limit defaults to 20 and is clamped to a max of 200. /api/v1/refresh and
/api/v1/stop require Authorization: Bearer <control-token>. On /ws connect the server sends
init (tickets), then ops_state if a snapshot is available; the runtime broadcasts ops_state to
connected clients on each update. The exact payload shapes, query params, auth requirements, and
error codes are in reference/http-api.md.
The trace REST routes (/api/v1/issues/*, /api/v1/tickets/*) mount only when both server.traceDir and an IssueStore are present. The CLI supplies both, so they are live under the daemon. Issue metadata defaults to ~/.lorenz/issues.db; configure server.issue_store_path when separate daemons under the same home directory must not share dashboard history.
The runs command
lorenz runs queries GET /api/v1/runs against a running daemon and renders the result as a table or, with --json, as raw JSON. The daemon's observability server must be up.
The base URL precedence is --url (trailing slash trimmed), then --port when greater than 0, then the workflow's server.port when greater than 0. Port 0 counts as unset. With no resolvable port, the command errors.
| Flag | Effect |
|---|---|
--issue <id> |
Filter to one issue (identifier or id) |
--failed |
Only failed or stalled outcomes |
--cost |
Cost view (from token totals; dollar fields are null) |
--retries |
Retry view |
--id <runId> |
One run by id |
--limit <n> |
Cap result count |
--url <url> |
Explicit API base URL |
--port <port> |
API port on 127.0.0.1 |
--json |
Raw JSON instead of a table |
A 404 renders Run not found, a 503 renders Observability API unavailable. See features/run-history.md for what each run record carries.
Traceviz: per-issue timelines
Where the dashboards show live aggregate state, Traceviz shows one issue's full story: every thought, message, tool call, and turn the agent produced, in order.
Capture is a 1:1 byte trail. In apps/cli/src/main.ts, the runtime's onAgentUpdate callback hands each AgentUpdate to TraceEmitter.emit, which appends one JSON line to <traceDir>/<encodeURIComponent(issueId)>/trace.jsonl. One runtime event becomes one trace line. The emit is fire-and-forget; writes are serialized per file. The storage key is the issue id, not its identifier, so ENG/1 and ENG_1 stay in separate directories, and path traversal is rejected.
traceDir defaults to ~/.lorenz/issues (note issues, not traces).

Two pieces read those files, both from @lorenz/traceviz-core:
TraceWatcherpolls the trace directory every 500ms, reading files incrementally as they grow.parseTraceLinesturns rawTraceEventlines into presentation-readyDisplayEvents. It coalesces consecutive message and thought chunks, pairs eachtool_callwith itstool_call_updateto compute duration and error state, and drops runtime types (rate_limit,session_started,process_exit,stderr,fs_write) that have no place in the timeline.
TraceEvent (the on-disk line, keyed by runtime type) and DisplayEvent (the parsed UI event, keyed by kind) are different types. The full event vocabulary is in reference/events.md.
Viewing a trace
Under the live daemon, open #/trace/<issueId> in the web dashboard. The viewer subscribes over /ws: it sends {type: 'subscribe', issueId}, receives a full events snapshot, then receives events_append deltas as the watcher detects new lines. A client scrolled away from the live edge gets a "new updates" pill instead of having its view mutated under it.
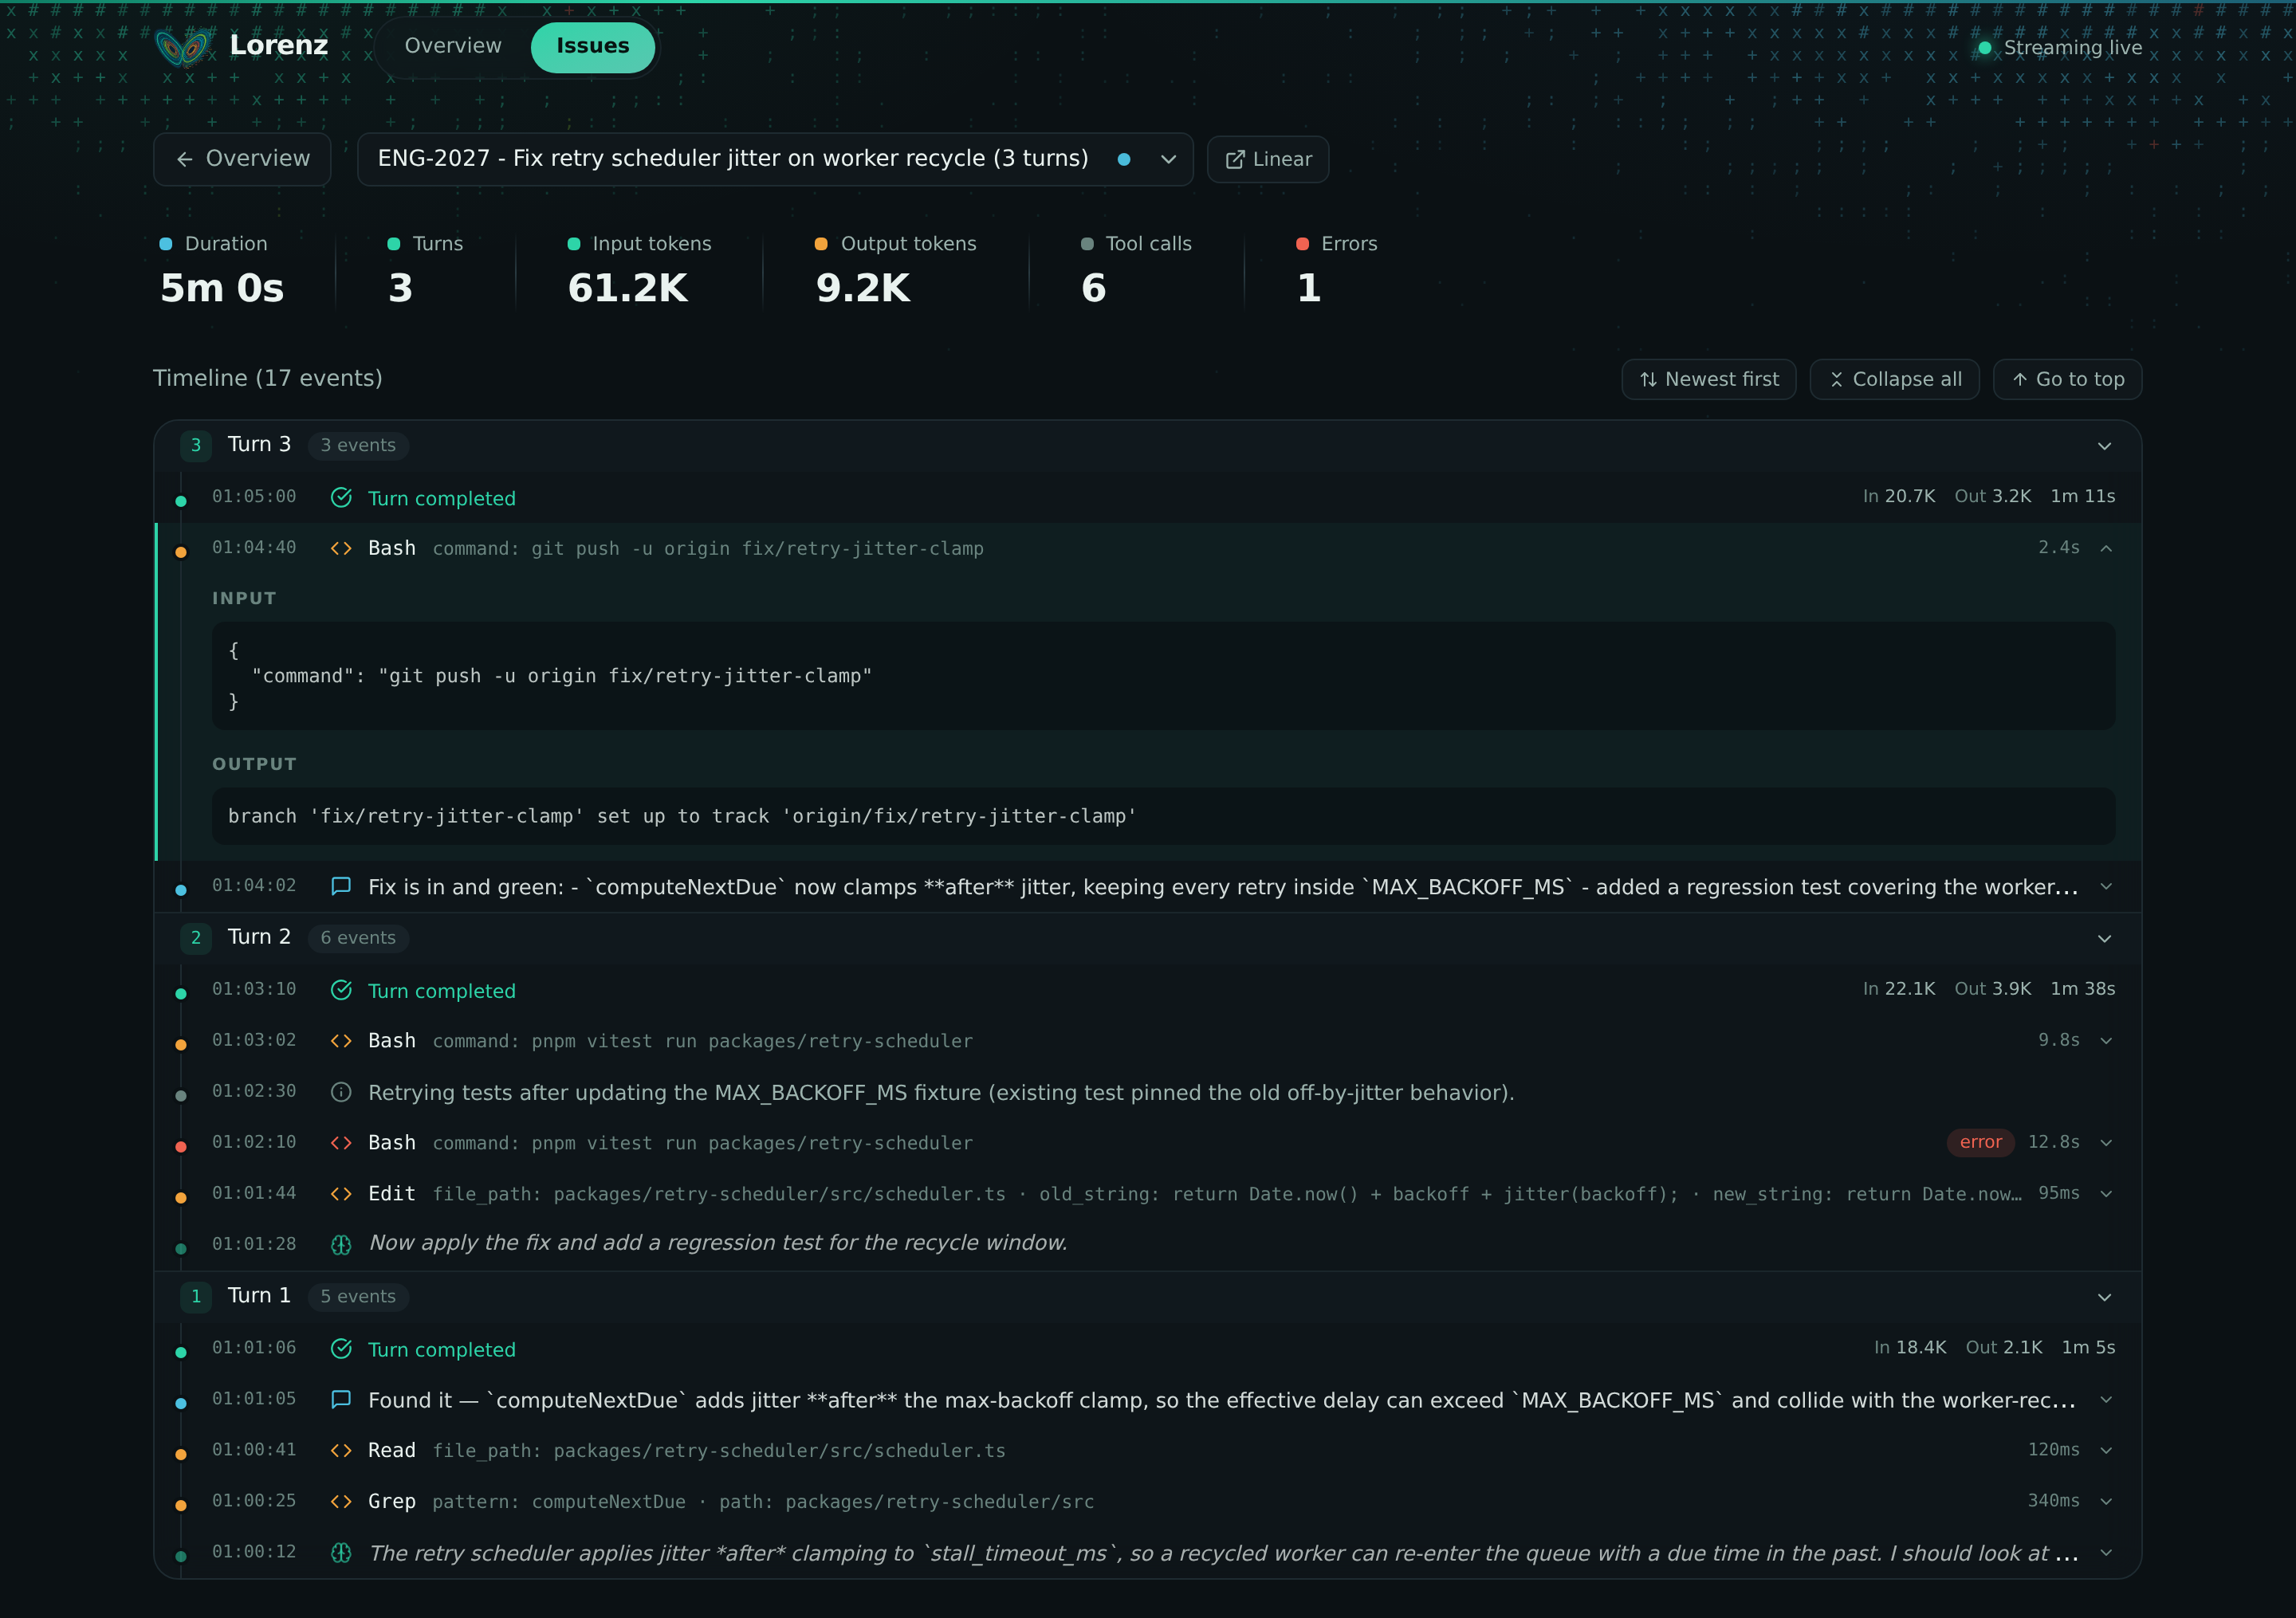
The header summarizes the run (duration, turns, token totals, tool-call count, errors); the timeline below it groups events by turn, with each thought, message, and tool call timestamped and expandable.
To inspect a single trace file outside the daemon, use the standalone viewer:
pnpm traceviz path/to/trace.jsonl
This loads one file at startup, computes its events and stats once, and serves a read-only viewer on http://localhost:4040. It prints a #/trace/<encoded issueId> link to open. The standalone viewer needs the dashboard built first; it does not build the UI itself.
Logs
Lorenz writes a structured log to logging.log_file, default ~/.lorenz/log/lorenz.log. The active path is surfaced in the snapshot as log_hints.lorenz_log_file.
To relocate the log, pass --logs-root <path> to the daemon; logs then go to <path>/log/lorenz.log. See troubleshooting.md for reading the log when a run stalls.
Configuration summary
| Key | Default | Meaning |
|---|---|---|
observability.dashboard_enabled |
true |
Declared and parsed; the daemon controls the web server via --no-dashboard |
observability.refresh_ms |
1000 |
Declared; not consumed by the TUI (hardcoded 250ms) |
observability.render_interval_ms |
16 |
Declared; not consumed by the TUI |
server.host |
127.0.0.1 |
Bind host for the web server |
server.port |
4040 |
Bind port; 0 means ephemeral; rewritten to the bound port after start |
server.mcp_port |
unset | Optional loopback-only port for remote per-run MCP claims; local agents always share server.port; changing it requires a restart |
server.traceDir |
~/.lorenz/issues |
Per-issue trace.jsonl directory; enables trace routes with the issue store |
server.issue_store_path |
~/.lorenz/issues.db |
SQLite issue metadata path; use separate paths to isolate dashboards for multiple daemons |
server.staticDir |
built dashboard dir | Override for the prebuilt SPA assets |
logging.log_file |
~/.lorenz/log/lorenz.log |
Structured log path |
CLI flags that affect observability: --no-tui, --no-dashboard, --port <port>, --logs-root <path>. Full key reference: reference/configuration.md.
See also
- cli.md - the
lorenzdaemon and its flags - reference/http-api.md - exact route shapes, payloads, and error codes
- reference/events.md - runtime, WebSocket, and trace event vocabulary
- features/run-history.md - what each run record carries
- troubleshooting.md - diagnosing stuck or failing runs from the views and logs